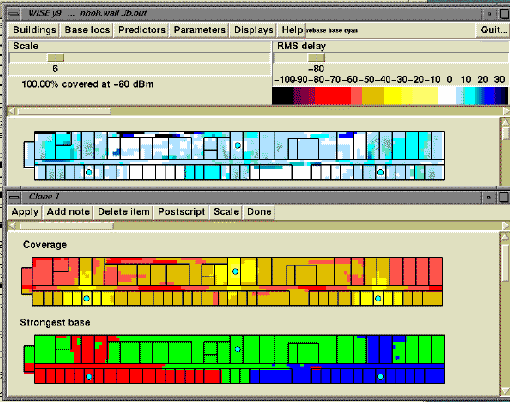
Figure 3 shows the plan view of one floor of the Hynes Convention Center in Boston as it appears through this interface, with a base station placed at the center of the circular area near the bottom left. This building has 313 walls. Normally this would appear in brilliant color; you may be seeing a photocopy of gray scale, which is not nearly as nice.
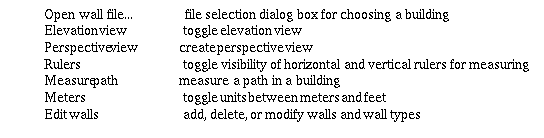
As may be seen in Figure 3, there are menu buttons across the top of the display for Buildings, Base locations, Predictors, Parameters, Displays, and Help. Each of these buttons raises a sub-menu of further choices. For example, the Buildings menu offers these choices (along with a few others):
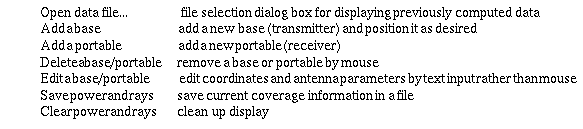
Similarly, the ``Base locs'' menu includes these choices:
The Predictors menu offers choices of
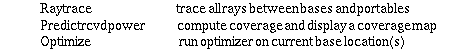
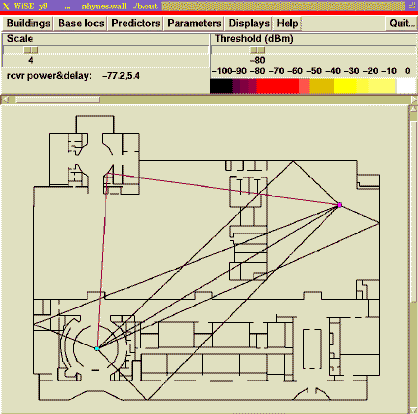
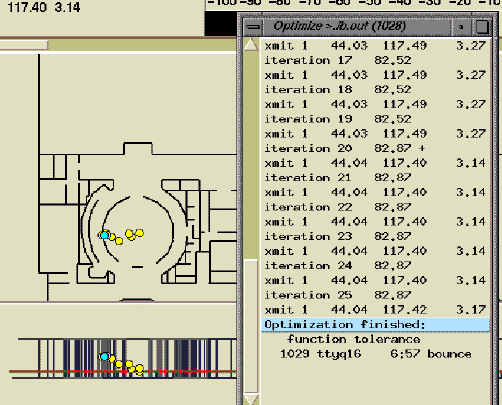
Figure 5 shows the result of running an optimization with the base originally at the location shown in Figures 3 and 4. This run took 7 minutes, and with 25 iterations managed to improve the coverage from 74.75% to 82.87%. We have included the elevation view along with the plan view to make it clear that the base moves in three dimensions. The yellow circles are intermediate positions at which an improvement was obtained; the blue circle is the final location.
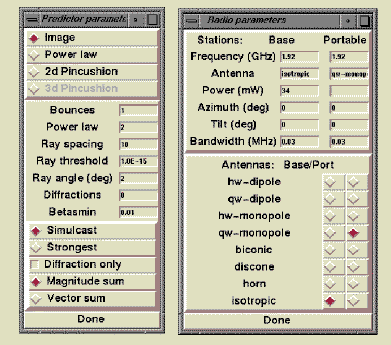
The Parameters menu provides a variety of submenus for setting parameters of the predictors, radio, grid spacing, optimization, and color map. It also provides for saving and restoring current parameter settings and/or base locations, and for restoring all parameters to their default state. Figure 6 shows the Predictor and Radio parameter menus to illustrate the general style.
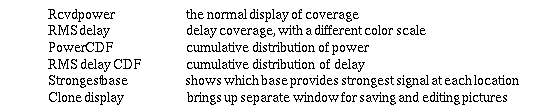
The Displays menu provides a variety of submenus