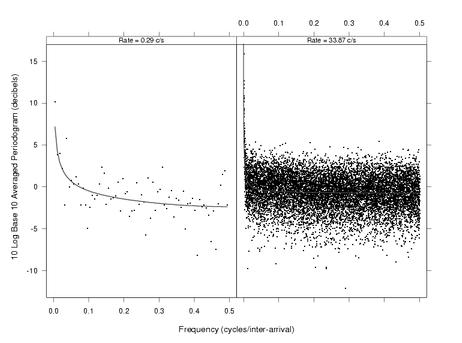
 The log averaged periodogram is graphed against frequency for two
blocks of packet sizes with low and high connection rates. The solid
curve is the ATS (Averaging, Transformation, and Smoothing) estimate
(Cleveland, Mallows, and McRae, JASA, 1993)
of the log power spectrum for our model as described in the paper
"On the Nonstationarity of
Internet Traffic".
The log averaged periodogram is graphed against frequency for two
blocks of packet sizes with low and high connection rates. The solid
curve is the ATS (Averaging, Transformation, and Smoothing) estimate
(Cleveland, Mallows, and McRae, JASA, 1993)
of the log power spectrum for our model as described in the paper
"On the Nonstationarity of
Internet Traffic".
Here
is a collection of spectrum plots
(compressed postscript,
pdf)
of packet inter-arrival times used in the paper
"On the Nonstationarity of
Internet Traffic". Due to large file size of the original plots, only
a subset of 25 intervals out of
500 intervals is available for download here.