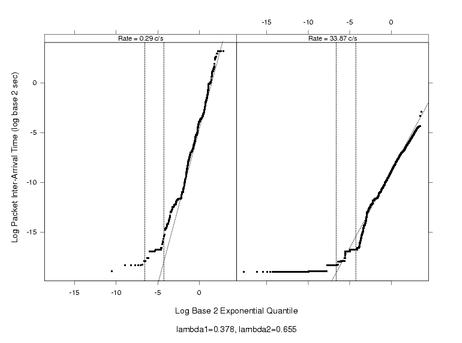
 This is a trellis display with one page and two panels; it displays the
quantiles of log inter-arrival times against log Weibull
quantiles. The vertical lines show the 1% and 5% quantiles. The
oblique line is drawn through the two quartile points.
If the marginal distribution of the inter-arrival times is well
approximated by a Weibull distribution, the the pattern of points on
the plot is approximately linear.
This is a trellis display with one page and two panels; it displays the
quantiles of log inter-arrival times against log Weibull
quantiles. The vertical lines show the 1% and 5% quantiles. The
oblique line is drawn through the two quartile points.
If the marginal distribution of the inter-arrival times is well
approximated by a Weibull distribution, the the pattern of points on
the plot is approximately linear.
Here
is a collection of Weibull quantile plots
(compressed postscript,
pdf)
of packet inter-arrival times used in the paper
"On the Nonstationarity of
Internet Traffic". Due to large file size of the original plots, only
a subset of 25 intervals out of
500 intervals is available for download here.