Xbae Demonstration
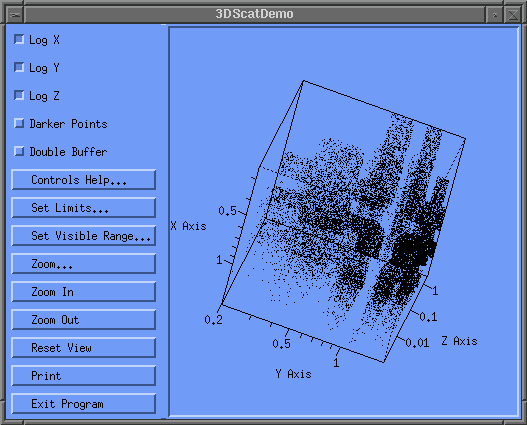
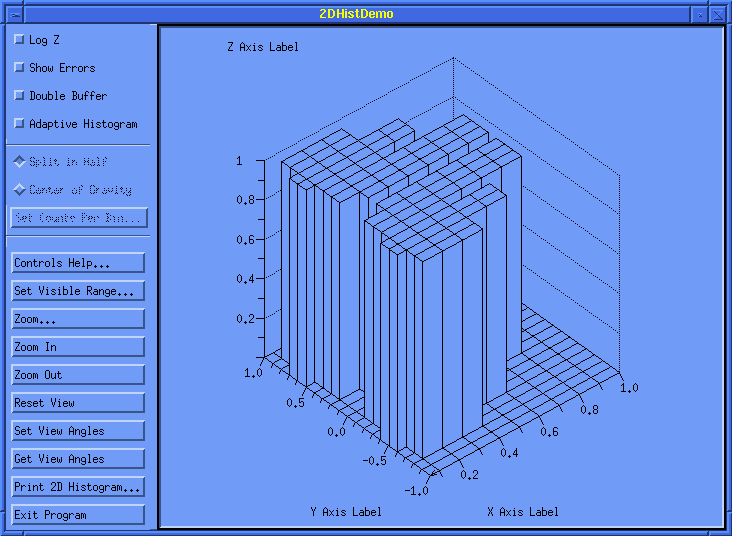
The following is the output of 3 of the demo programs
that accompanies the Plot widgets.
Note that in each, the user can drag the axes tick marks
to zoom in and out to see specific features of the plots.
Also, the 2D histogram and 3D scatter plots can be rotated
interactively to view the plot from different viewpoints.
Acknowledgements
The Plot code is developed
by the Fermi National Accelerator Laboratory
for a tool they call Histo-Scope.
Contact
| Mark Edel |
|---|
| edel@fnal.gov |
|---|
| Fermi National Accelerator Laboratory |
|---|
| P.O. Box 500 |
|---|
| Batavia, IL 60148 |
|---|
Duncan Temple Lang<duncan@stat.Berkeley.EDU>
Last modified: Mon Mar 3 09:54:37 PST 1997