<?xml version="1.0"?>
<!DOCTYPE doc>

<doc>
<h1>Summary</h1>

<table>
<tr>
<th align="left">
We start by looking at simple summaries of the entire
dataset and examining the characteristics of the distribution
of a collection of numbers generated from a random <a
href="Normal">normal distribution</a>.
<p/>
This provide us with numerical values
describing the basic aspects of the observed values.
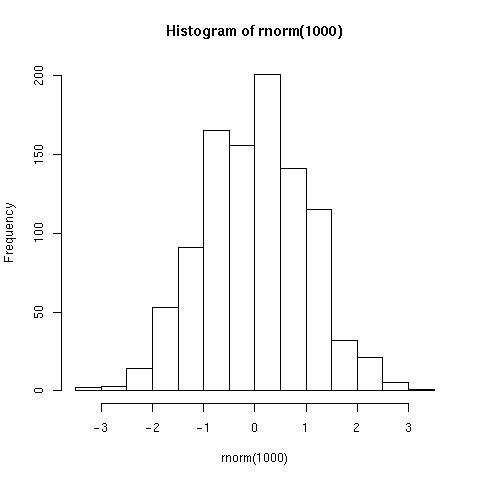
We can also look at a histogram of these to get
the relative frequencies of the different
values.
<h1>Simulating Different Samples</h1>

Now, we allow you to create your own samples.  Click the <i>sample</i>
button to update the table and the histogram.
<form>
 <table>
 <tr><th><input type="text" value="20" name="size"/></th><th><input type="submit" value="Sample"/></th></tr>
 </table>
</form>

</th>
<th>
<code lang="S" init="T">
<![CDATA[
 n <- 20
]]>
</code>
<code lang="S">
 summary(rnorm(n))
</code>
<summary>
 <quantile name="Min">-20.1278</quantile> 
 <quantile name="1Q"> -6.9110</quantile> 
 <quantile name="Median">-0.1529</quantile> 
 <mean>0.1322</mean> 
 <quantile name="3Q">7.3709</quantile> 
 <quantile name="Max">22.7147</quantile> 
</summary> 
<br/>
<script>
 defaultStatus="Move the mouse over the different parts of the plot!";
</script>
<img src="hist.jpg" usemap="#foo"/>
<map name="foo">
 <area shape="rect" coords="0,0,100,500" href=""
    onMouseOver="status='Relative frequency of the number of values
within a bin';return true;"/>
 <area shape="rect" coords="250,50,280,400" href="bar.html" onMouseOver="status='Biggest bar';return true;"/>
 <area shape="rect" coords="0,50,480,450" href="bar.html"    onMouseOver="status='Hi there';return true;"/>
 <area shape="rect" coords="0,450,500,500" href=""
    onMouseOver="status='Range of the simulated values';return true;"/>
</map>
</th>
</tr>
</table>


<table width="50%">
<tr>
<th><applet code="area.class" width="400" height="50">
An applet
</applet>
</th></tr>
</table>

</doc>