Richard A. Becker, William S. Cleveland, Beat Kleiner & Jack L. Warner
AT&T Bell Laboratories (1978)
3:00 minutes
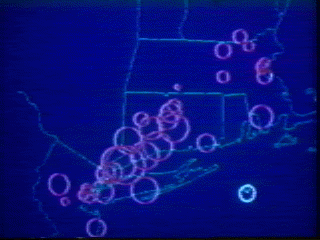
The video shows the regional nature of ozone transport in the Northeast US -- you can see ozone concentrations carried from the New York area into central Connecticut and Massachusetts, resulting in high ozone concentrations there, even though these areas do not produce the ozone themselves.
Ozone concentrations are represented by circle size (area?). The circle making up the clock is the size of the EPA standard for ozone.
The movie was shot frame-by-frame from a monitor on a DDP 224 computer running the GR-Z graphics software (the graphics subroutine library underlying S). Jack Warner did the coding and data management; Rick Becker was involved with the GR-Z library; Bill Cleveland and Beat Kleiner were responsible for the data analysis.
This could be a nice short subject. It could be used to stimulate discussion about the wide variety of ways in which such data could be represented. It could also supplement a discussion of the data itself; there are published papers on it. (The video is much clearer than this clip would suggest.)