Summary
We start by looking at simple summaries of the entire
dataset and examining the characteristics of the distribution
of a collection of numbers generated from a random normal distribution.
This provide us with numerical values
describing the basic aspects of the observed values.
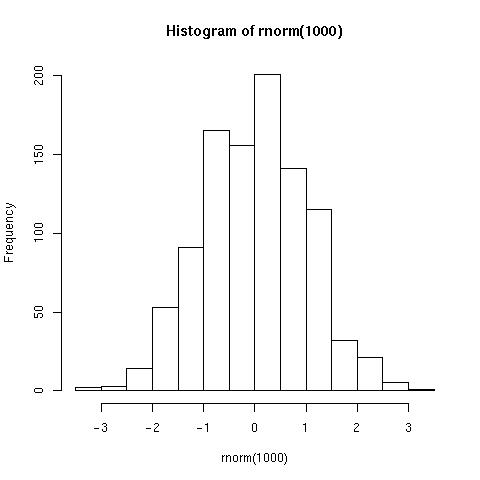
We can also look at a histogram of these to get
the relative frequencies of the different
values.
Simulating Different Samples
Now, we allow you to create your own samples. Click the sample
button to update the table and the histogram.
|
| Min |
1Q |
Median |
mean |
3Q |
Max |
| -20.1278 |
-6.9110 |
-0.1529 |
0.1322 |
7.3709 |
22.7147 |
|