 |
 |
Richard A Becker, Allan Wilks, and Steven Eick
AT&T Bell Labs (1992)
7 minutes
| |
|
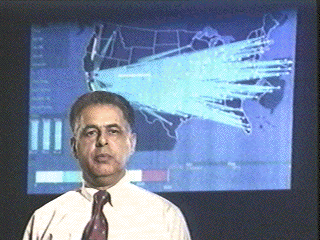
In the lefthand figure, Sandy Frasier, now VP of Research at AT&T Labs, stands in front of a Seenet display on the wallboard at the AT&T Network Operations Center in Bedminster, NJ. The display shows calls that could not be completed due to an earthquake in the San Francisco area.
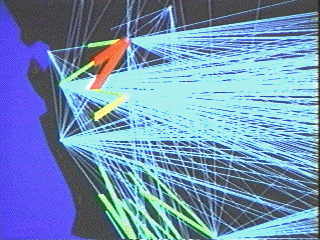
The figure at the right is an expanded view of the map showing that the heaviest blocking (represented by thick red and yellow lines) is taking place within California.
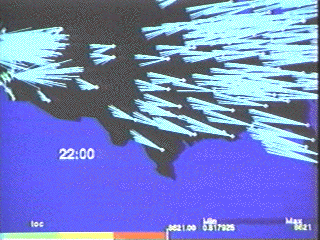
By pulling the lines back from their centers, the area in the middle of the map that was overlaid with lines is revealed, showing that there is no trouble in the network other than with calls directed to California.
 |
 |
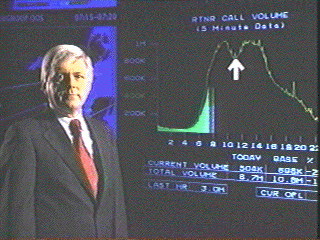
On the left, Jim Caroll(?) stands in front of a call volume display on the wallboard at the AT&T Network Operations Center in Bedminster, NJ. The yellow outline shows call volumes for various times of the day; the arrow points at the lunch-time dip.
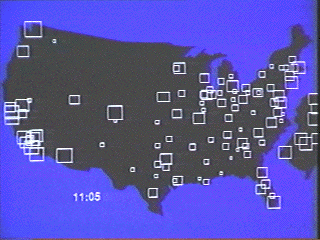
On the right is a display showing inbound and outbound calling (represented by the horizontal and vertical dimensions of the rectangles) from the switches in the AT&T network. This frame shows volumes at 11:05 and is part of an animation sequence.
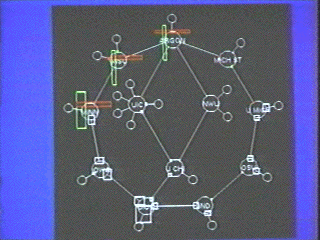
Seenet applied to data traffic from CICNET. The rectangles represent incoming and outgoing packet counts on various interfaces from routers in the network. This picture shows a flow of data from the node at 9 o'clock to the node at 12 o'clock.