There are generally many paths that contribute to the power received at a given site; for a path k from a transmitter to a receiver site, the power received is


A building coverage map is obtained by computing local mean received power over a dense grid of points throughout the building. A typical grid spacing of a meter or two implies a few thousand power computations.
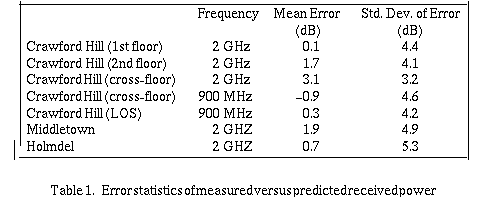
To establish the accuracy of this simplified prediction model, we have performed measurements in three different buildings. The measurements included line-of-sight (LOS), into rooms in the same corridor, adjacent corridor and cross-floor situations. Most of the measurements were performed at 2 GHz, although current validation efforts have included 900 MHz as well as 2 GHz. A rotating dipole antenna (2 meters above the floor) is used to sample the instantaneous signal strength about a local area. These samples are averaged to determine the local mean about the point in question. A detailed description of the measurement technique is given in [9] and [3]. The results are summarized in Table 1.

For these buildings, the average error was never more than 3.1 dB, and the standard deviation of the error was at most 5.3 dB.
Any model of radio prediction requires careful measurements for validation, and the model here is no exception. Measurement is particularly difficult inside buildings, since the environment surrounding and interfering with the radio signal has a profound effect on how the energy is propagated. Radio waves arrive at a receiver via numerous multipath components, each having different delays, strengths, and phases, These multipath electric field components interfere with each other both constructively and destructively, giving rise to rapid instantaneous fading. Reference [3] describes techniques for measurement of local mean signal strength.