 Visualization
As for most databases, visualization tools are vital for analyzing a very large database. Analytic visualization tools support model development. One issue is screen real estate. Because Internet databases are large and the structure is complex, we must accept the notion that single displays need to cover tens and perhaps hundreds of pages with many panels on each page. Data visualization is often limited to a display of a set of data that can be placed all at once in our visual field. So it can be shocking at first to contemplate looking at so many pages. But using the structure of trellis display, a visualization system available in S, it is easy to generate many pages. And using a document viewer, it is possible to learn a great deal about Internet traffic data from these multipage, multipanel, or MPMP, displays.
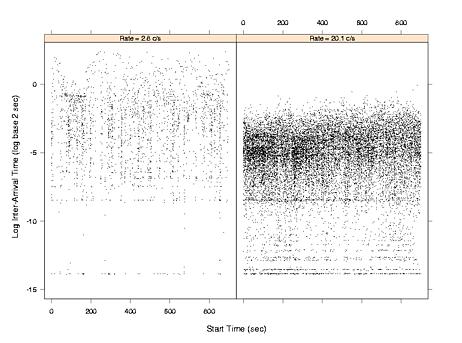
This is a trellis display with one page and two panels; it shows the HTTP start times for 2 of 10704 blocks of data. It was immensely informative for modeling the start times to see such displays for hundreds of blocks. And the only practical medium to communicate these MPMP displays is our medium of study, the Internet.
TCP Flow Plot:
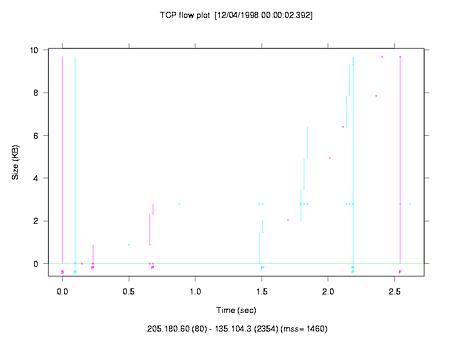
Transmission Control Protocol (TCP) is the key protocol that accomplishse most of the data transferring on the Internet. TCP does the transfer by establishing a connection> between the computers. The connection is not a physical path; rather, it is simply TCP software executing on the computers in a coordinated fashion, with each aware that it is working with the other. The connection continues until both sides agree that it is over, or until one side fails to hear from the other for a specified amount of time. Packets go back and forth between the two computers. For a packet, the source computer is the one that sends it out, the destination computer is the one that receives it.The details in a TCP transfer can be visualized by the following TCP flow plot:
| Home Papers Visualization S-Net |