Notes
Outline
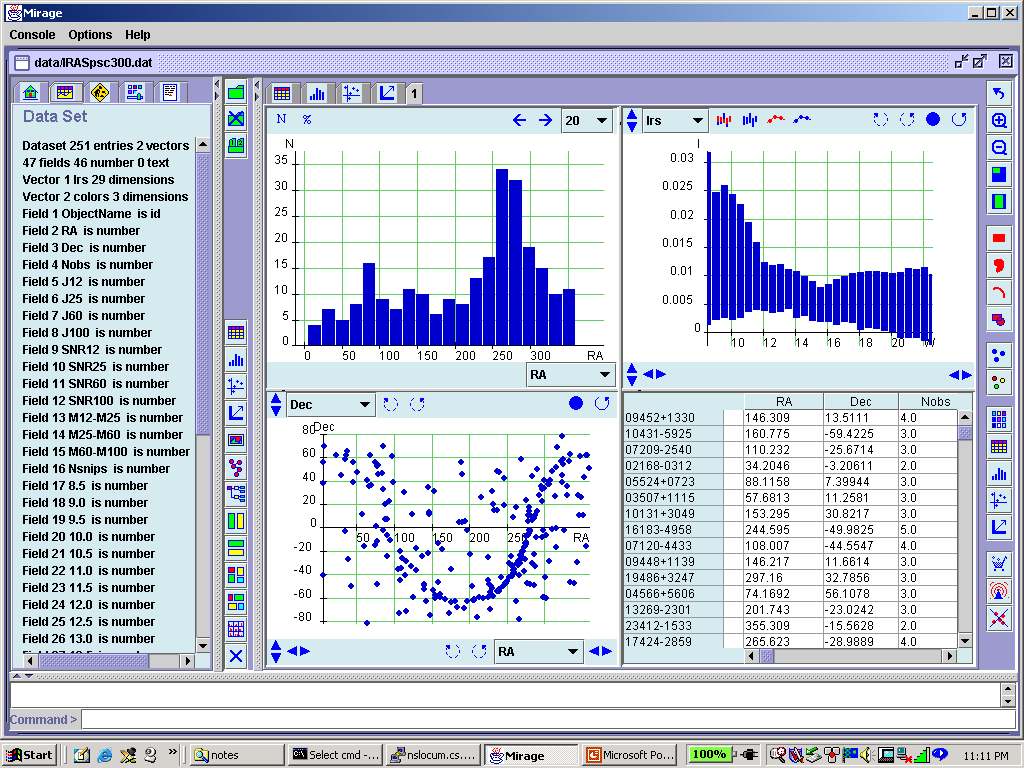
A Graphical Guide to the Usage of Mirage
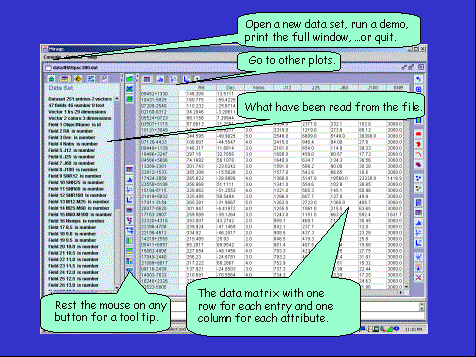
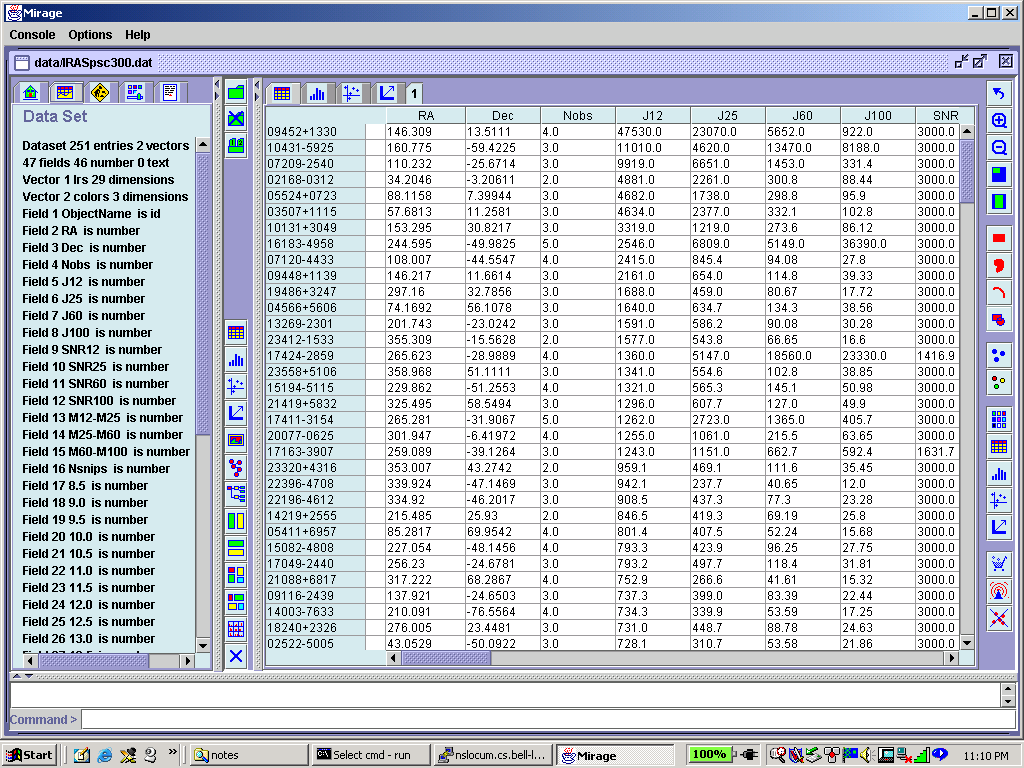
The data matrix
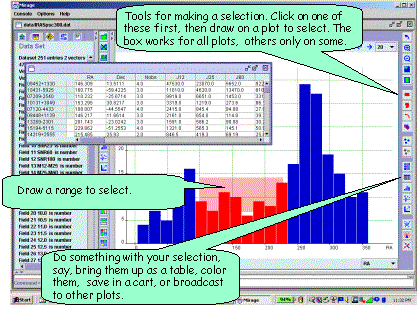
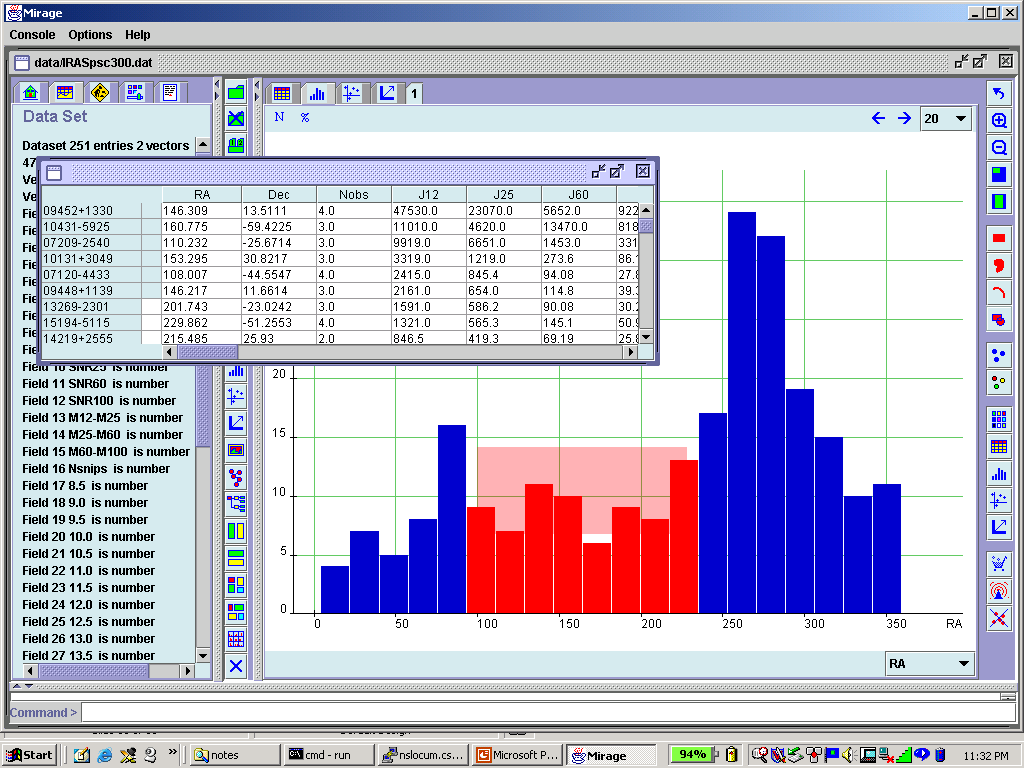
The histogram view
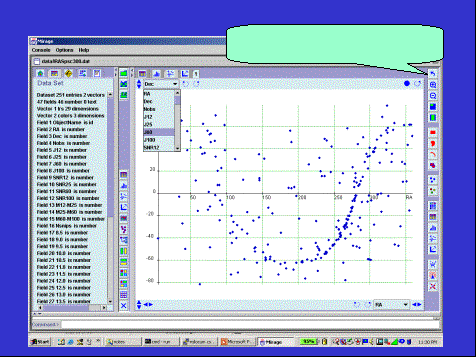
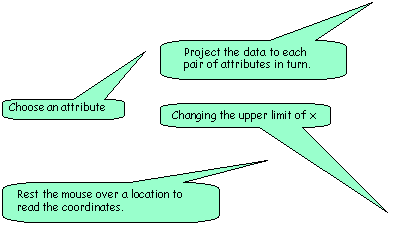
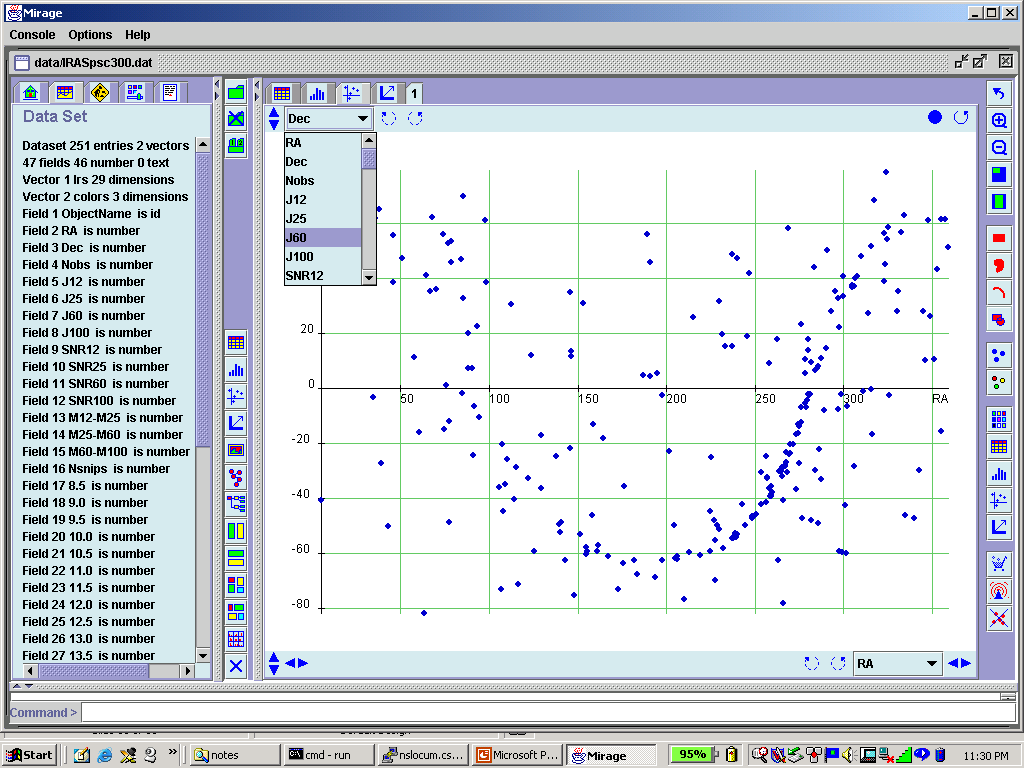
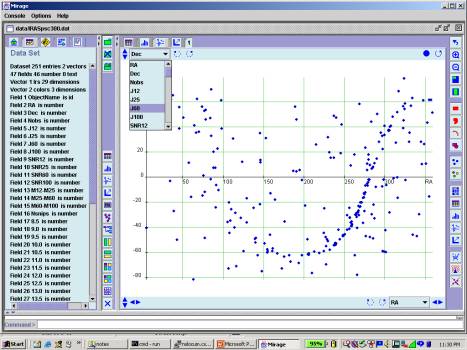
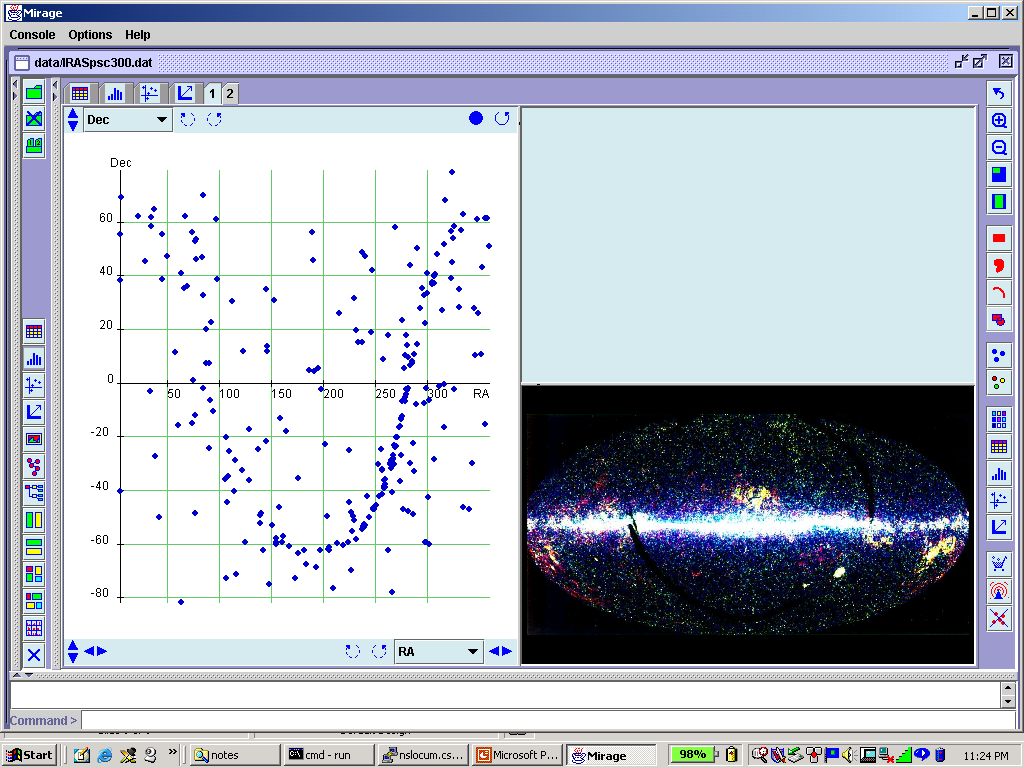
The scatter plot
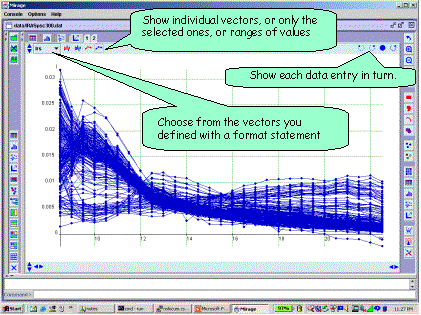
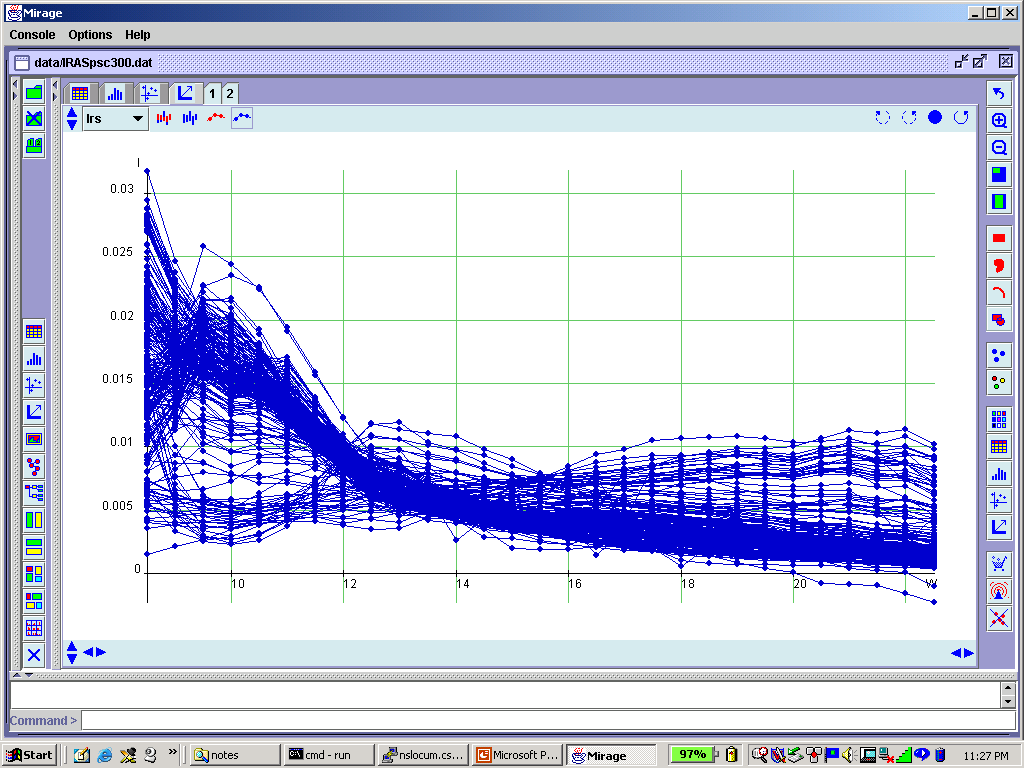
The feature vector plot
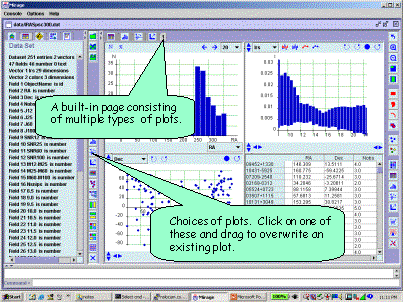
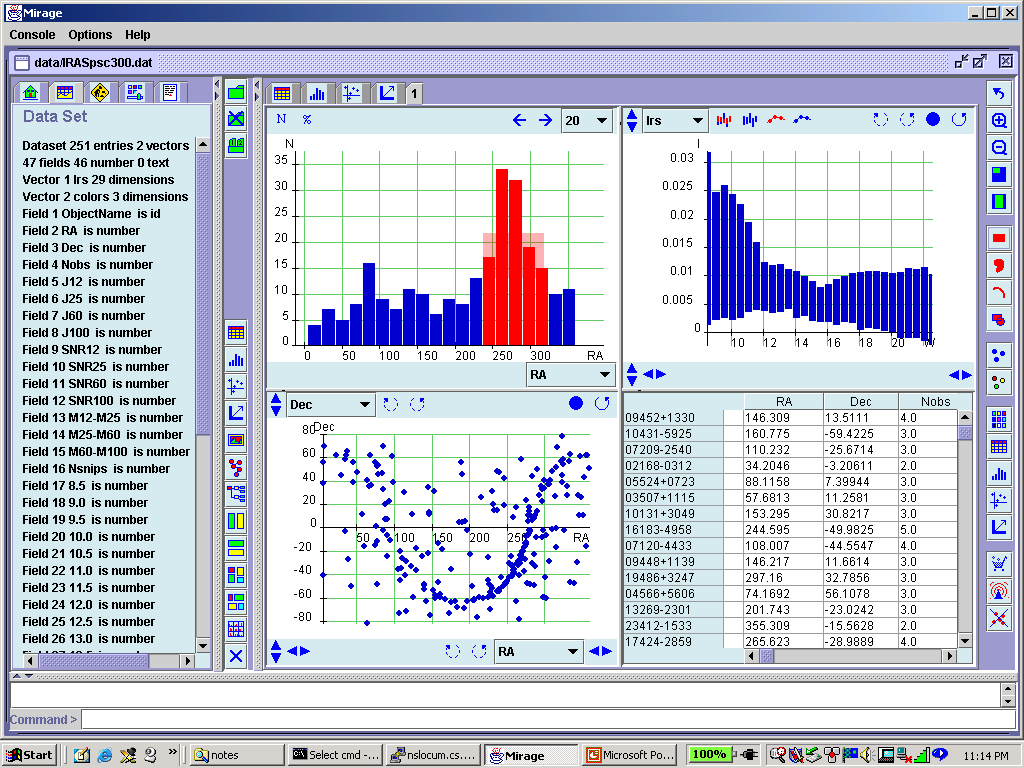
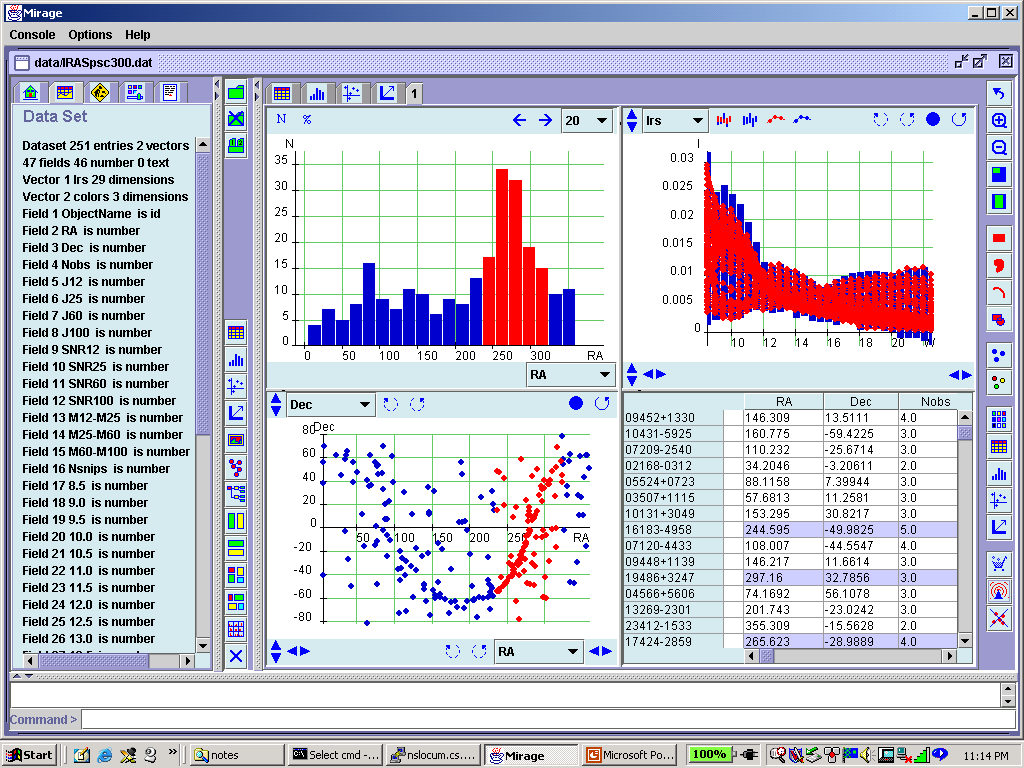
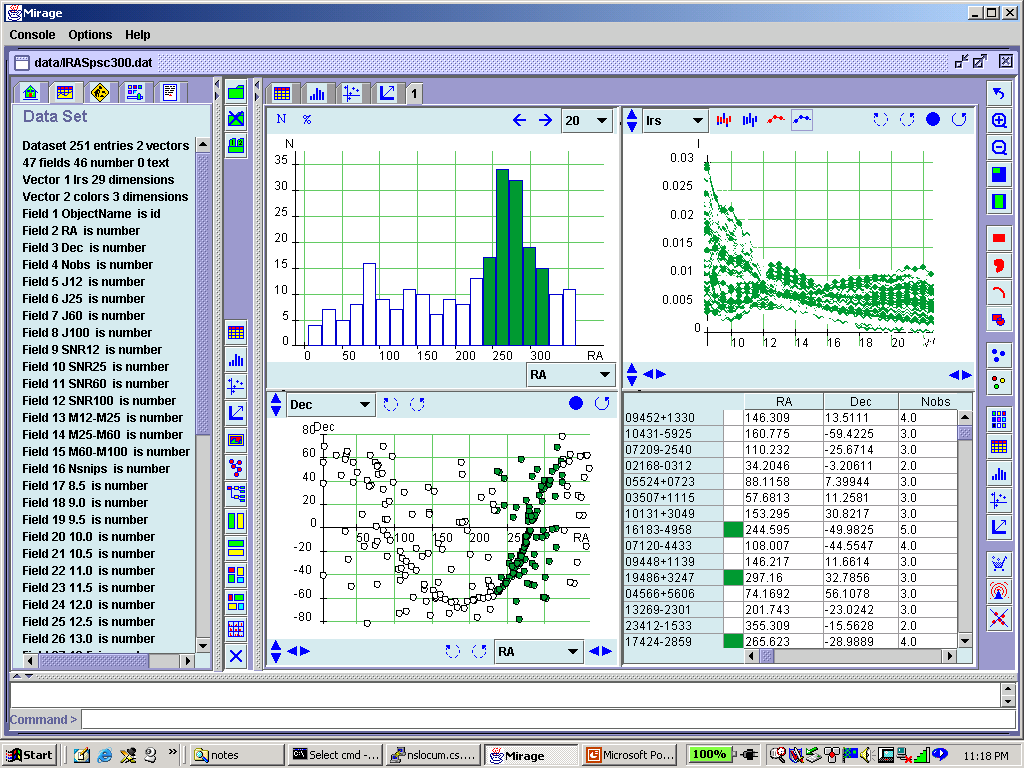
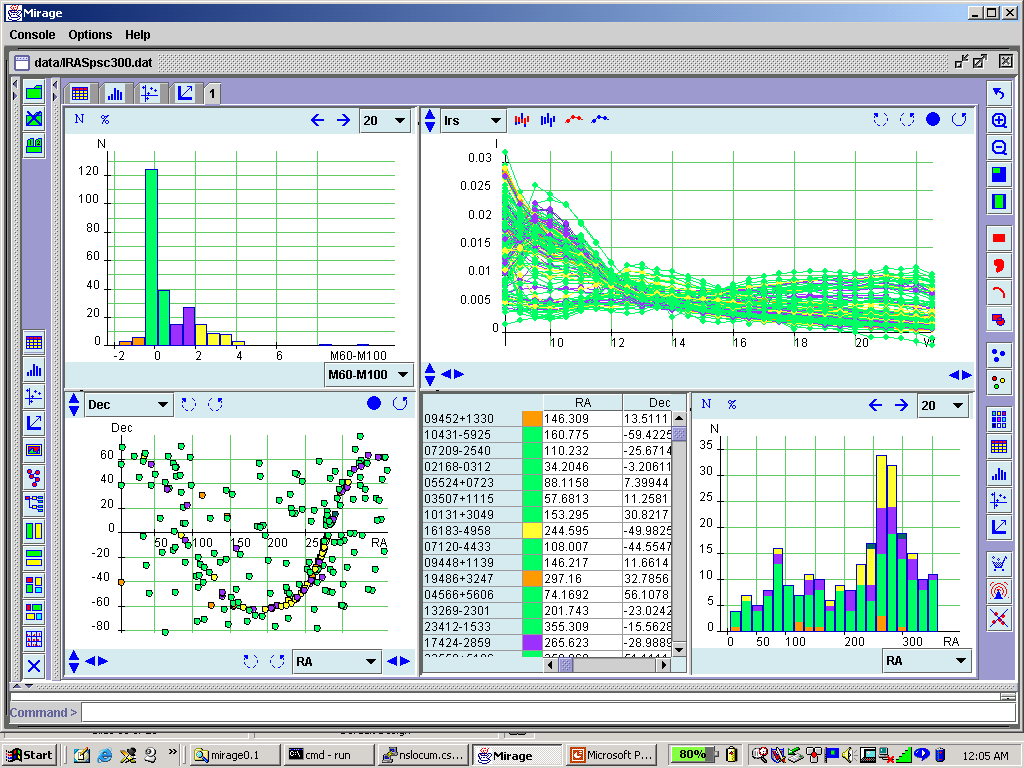
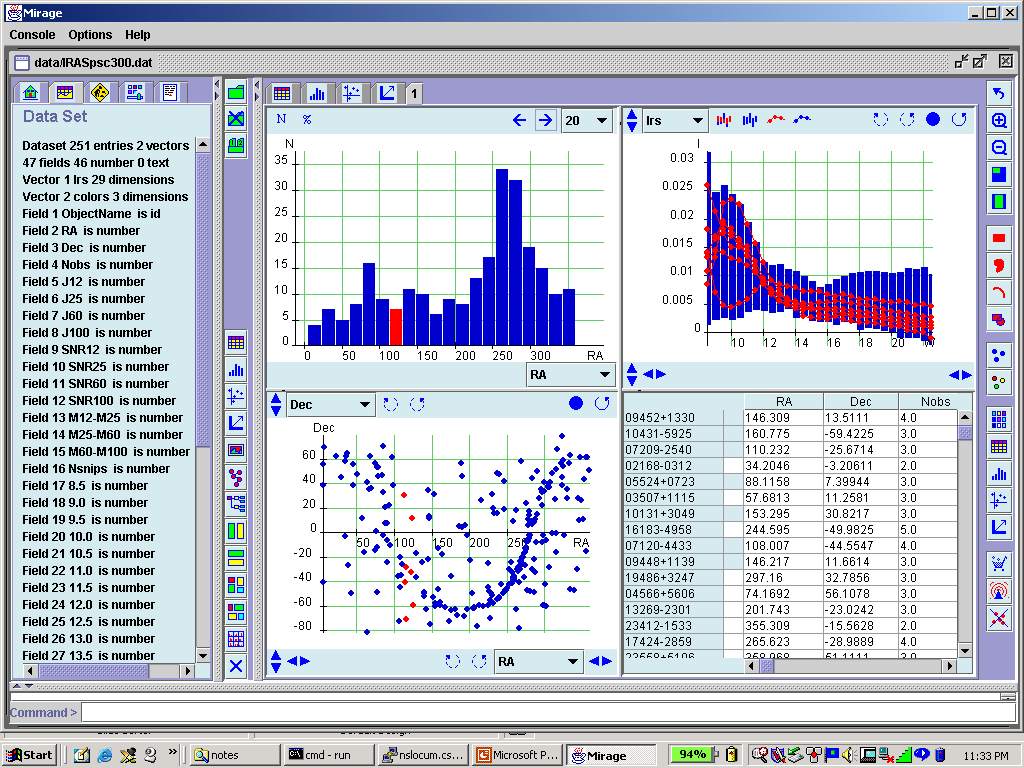
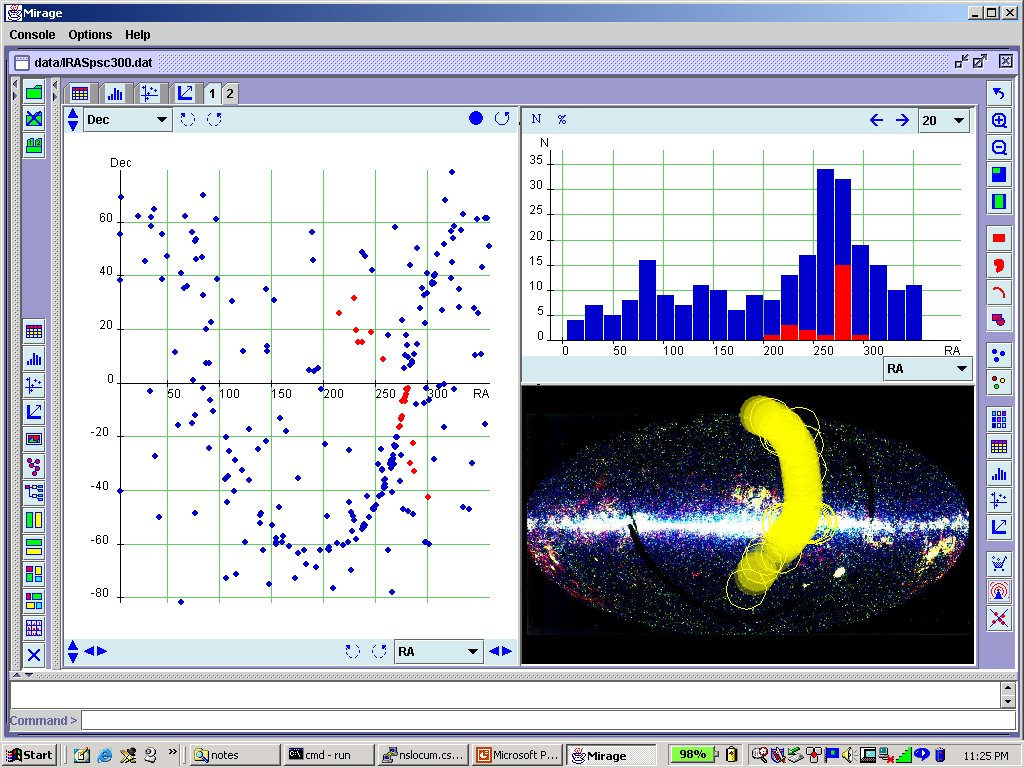
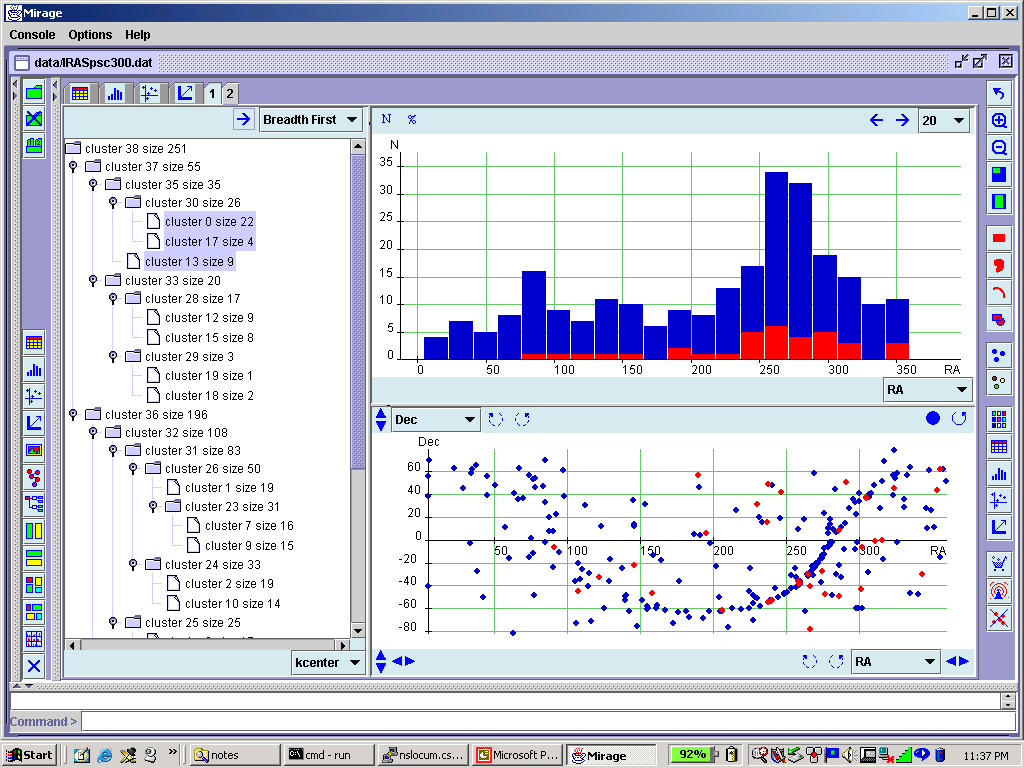
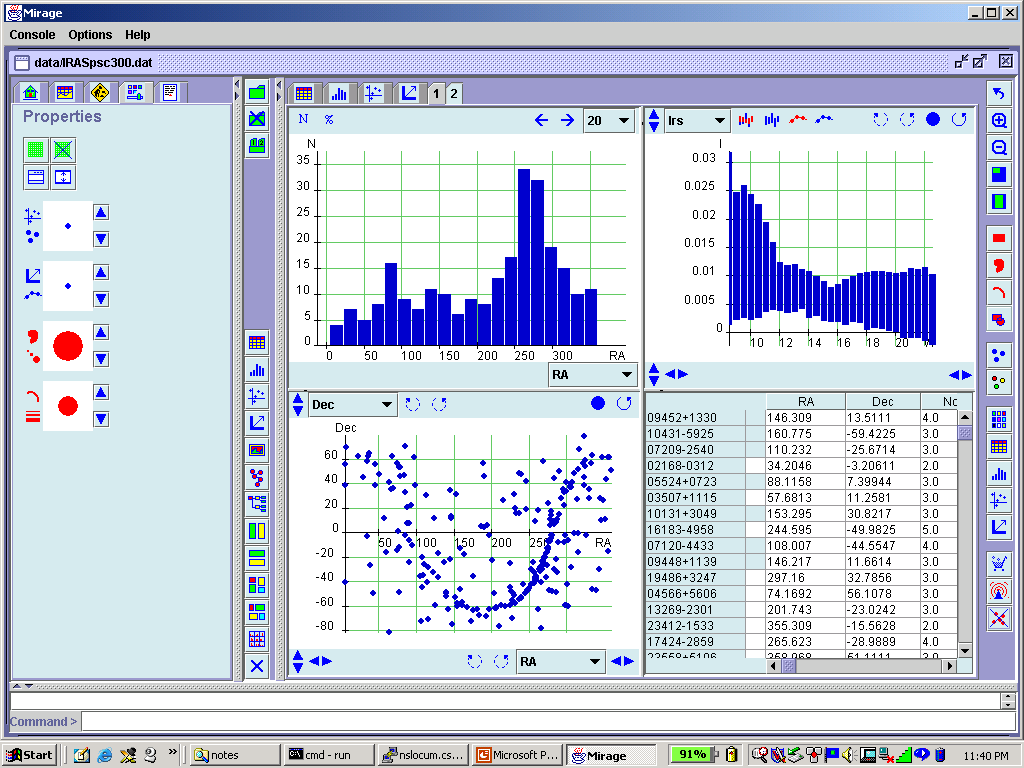
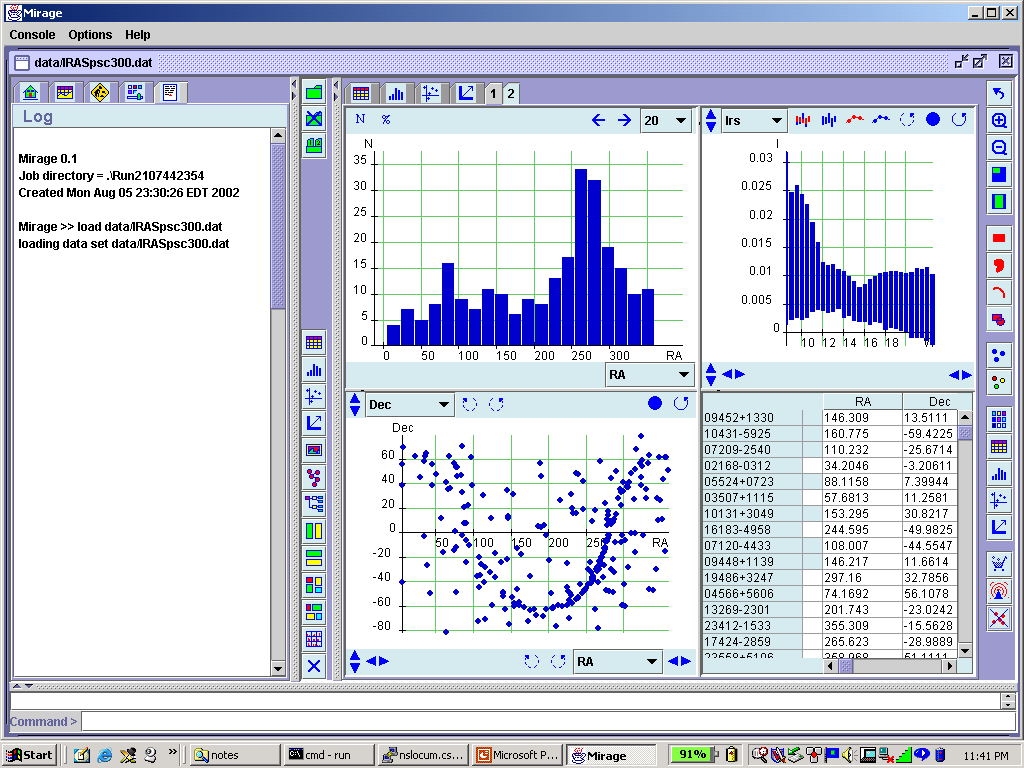
Linked view of multiple plots
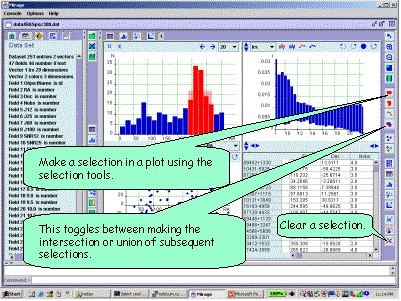
Selecting points in a plot
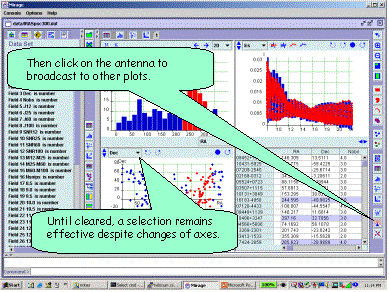
Broadcasting a selection
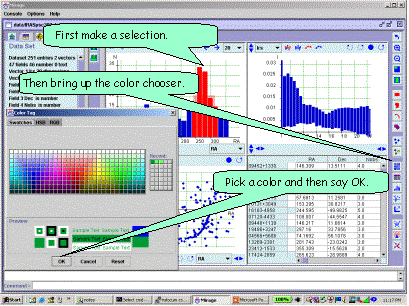
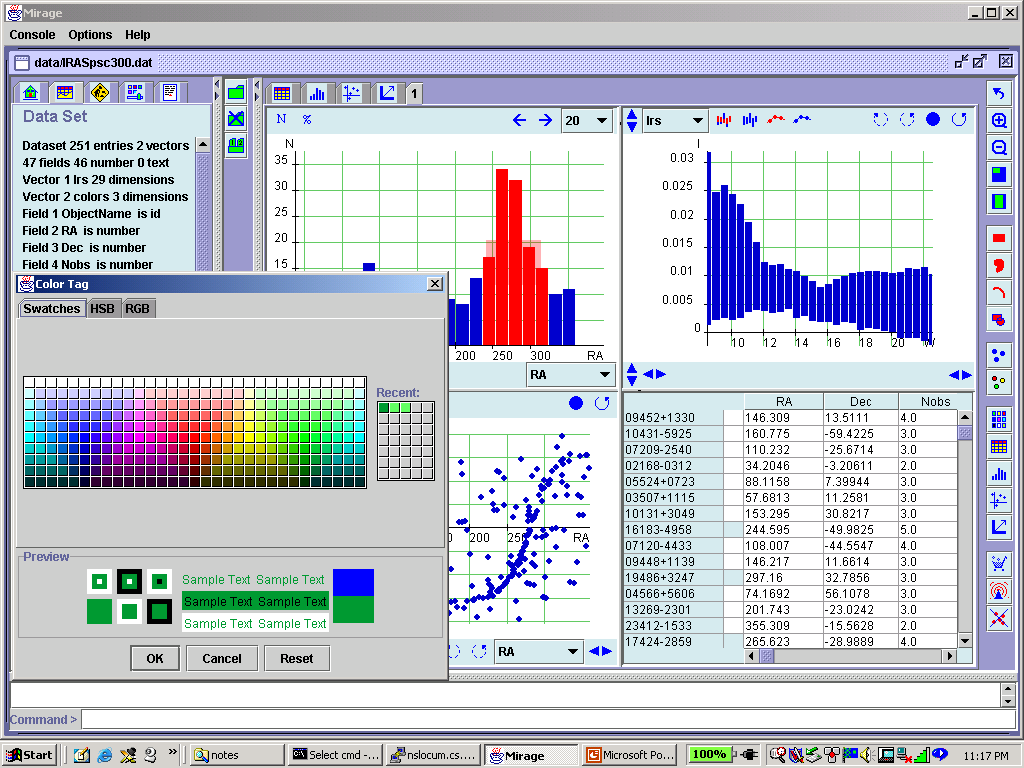
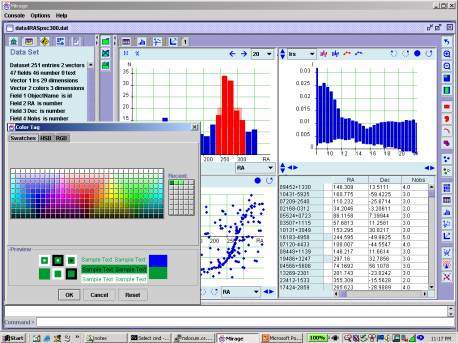
Coloring points permanently
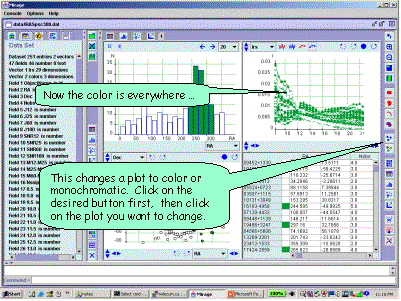
Tracking colors in different views
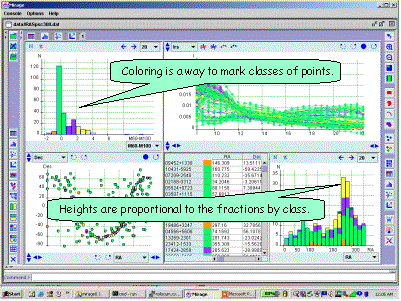
Coloring to mark classes
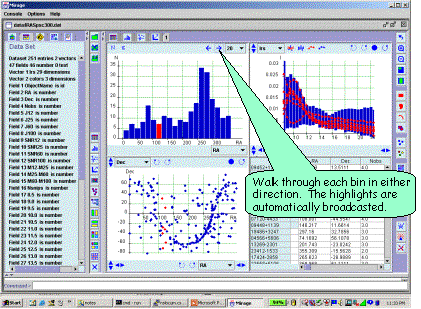
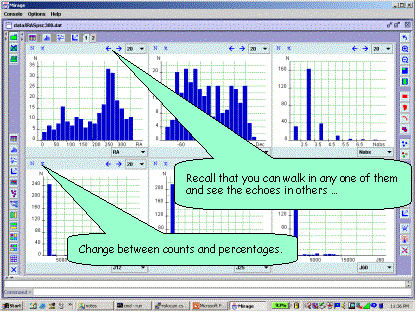
Walking in a histogram
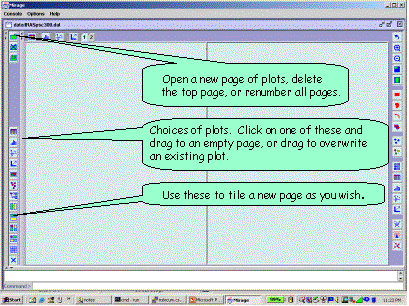
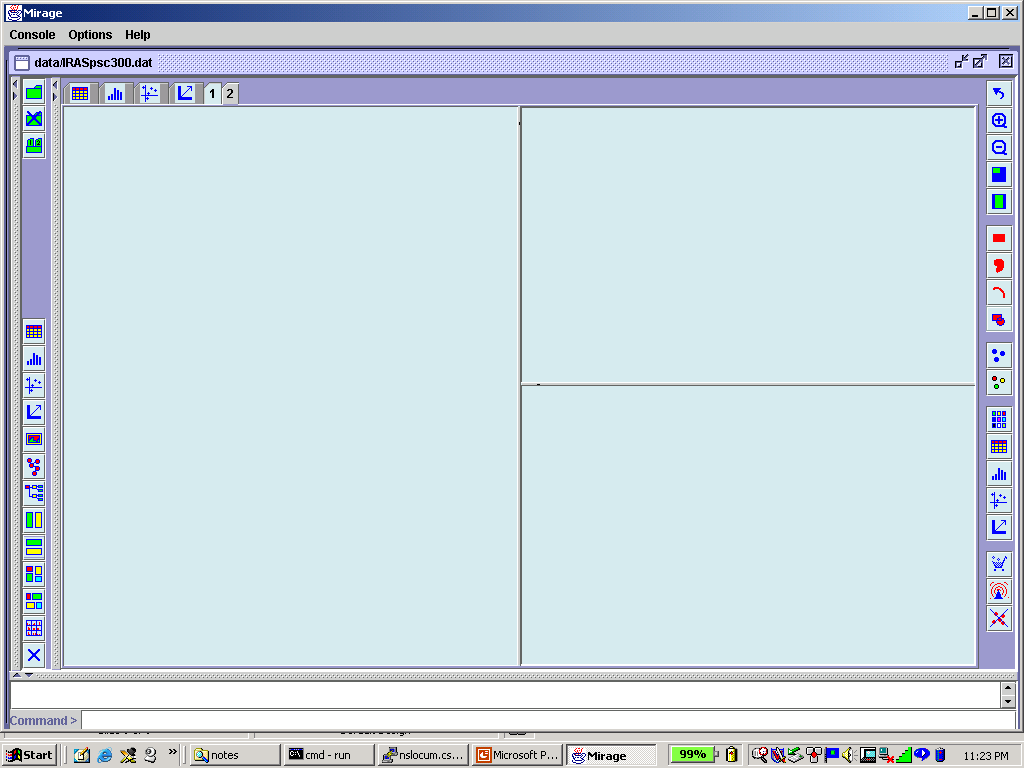
Configuring new pages of plots
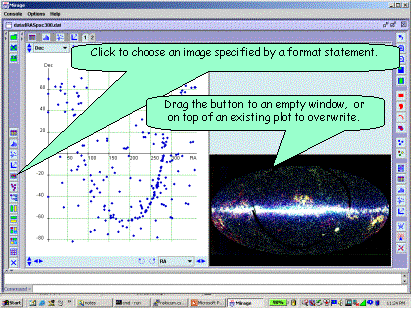
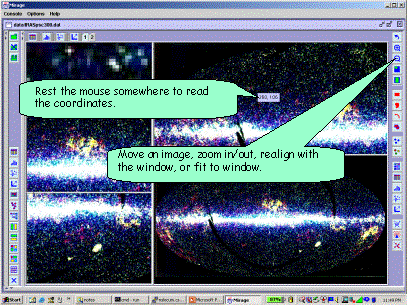
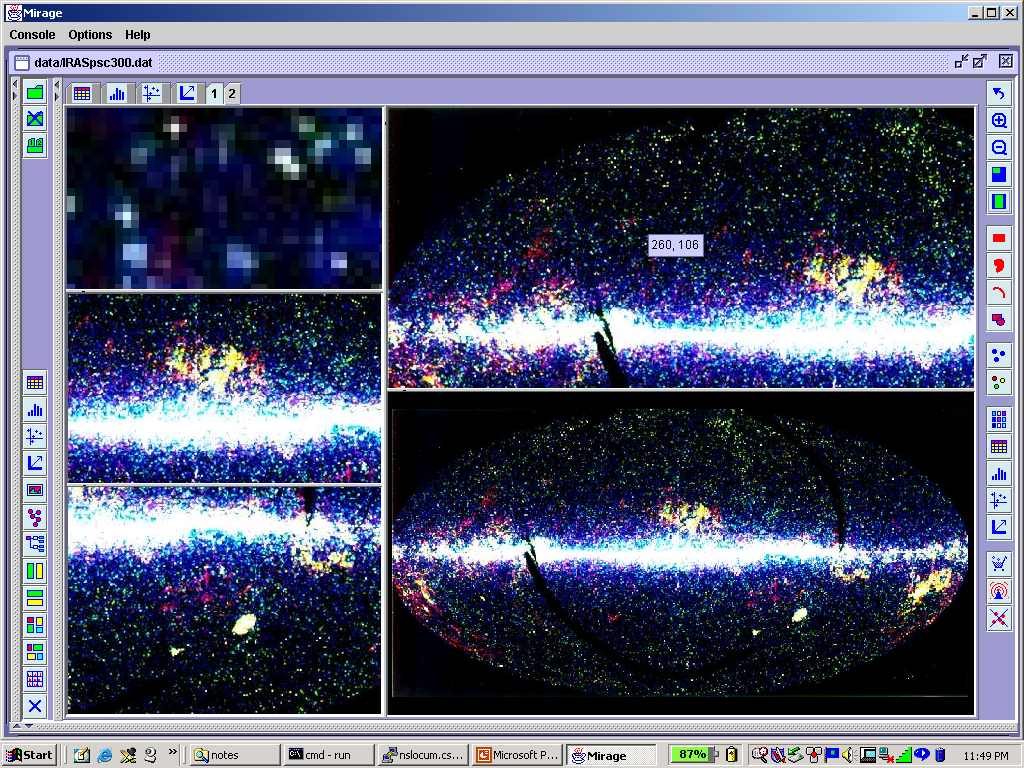
Showing images
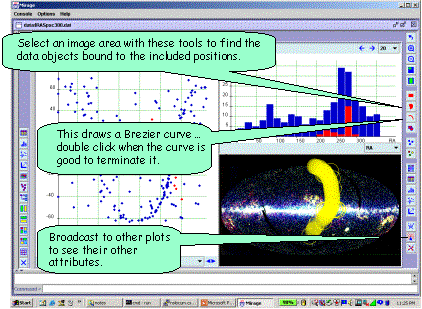
Selecting areas in an image
Seeing the same image in different resolutions and positions
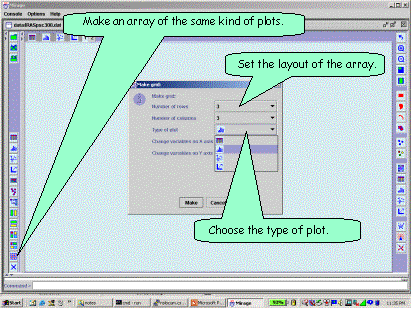
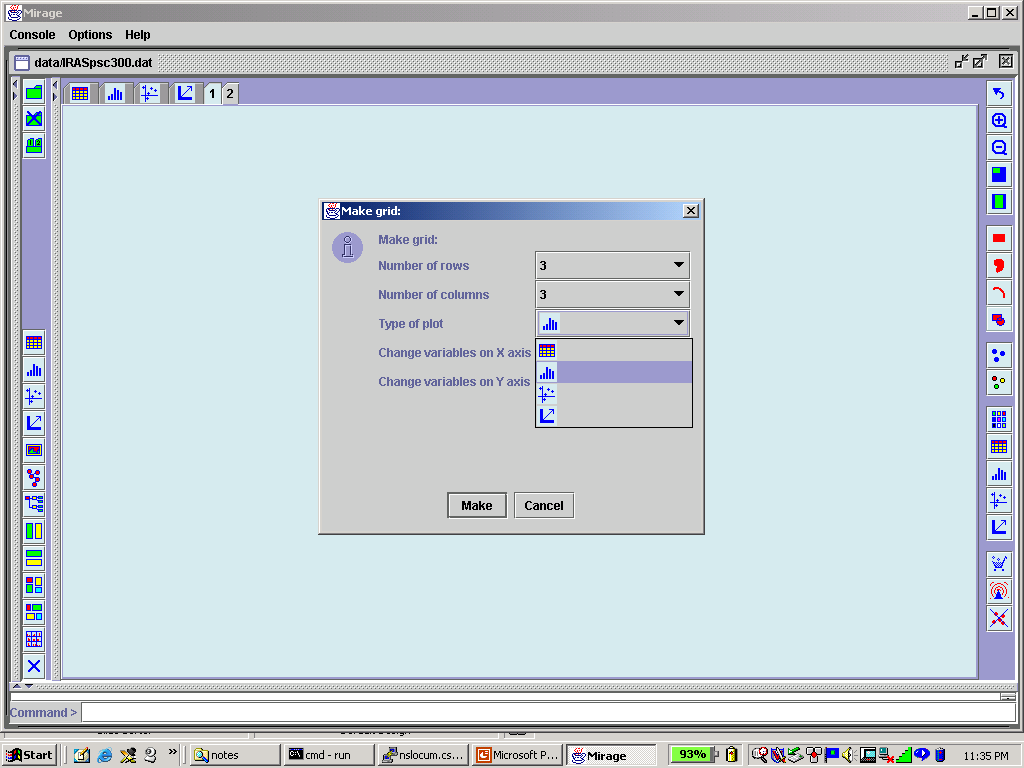
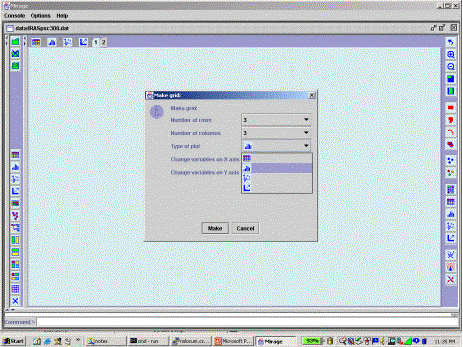
Making an array of the same type of plots
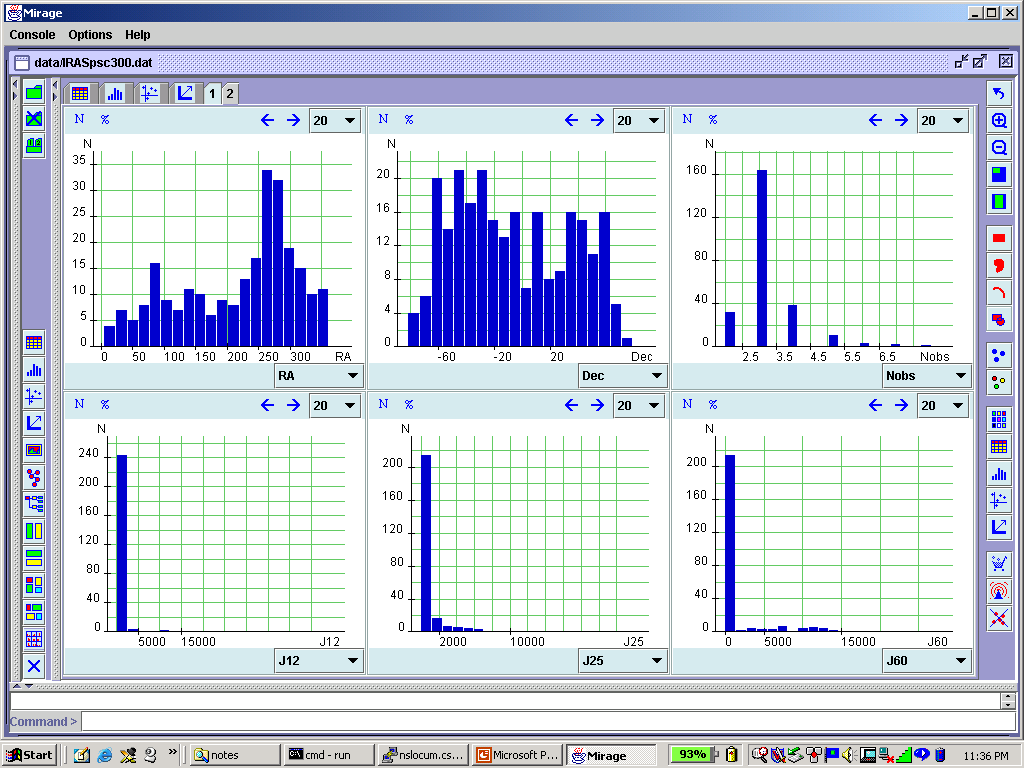
An array of histograms
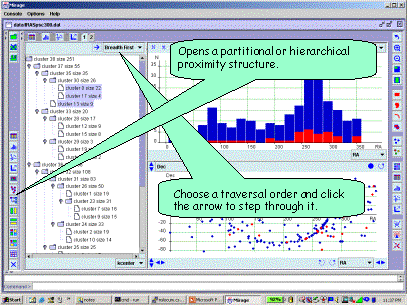
Displaying proximity structures
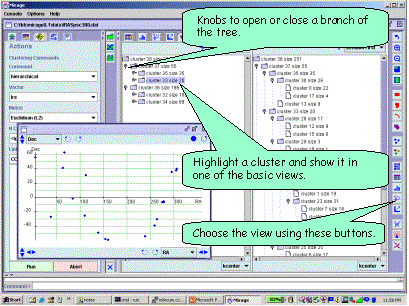
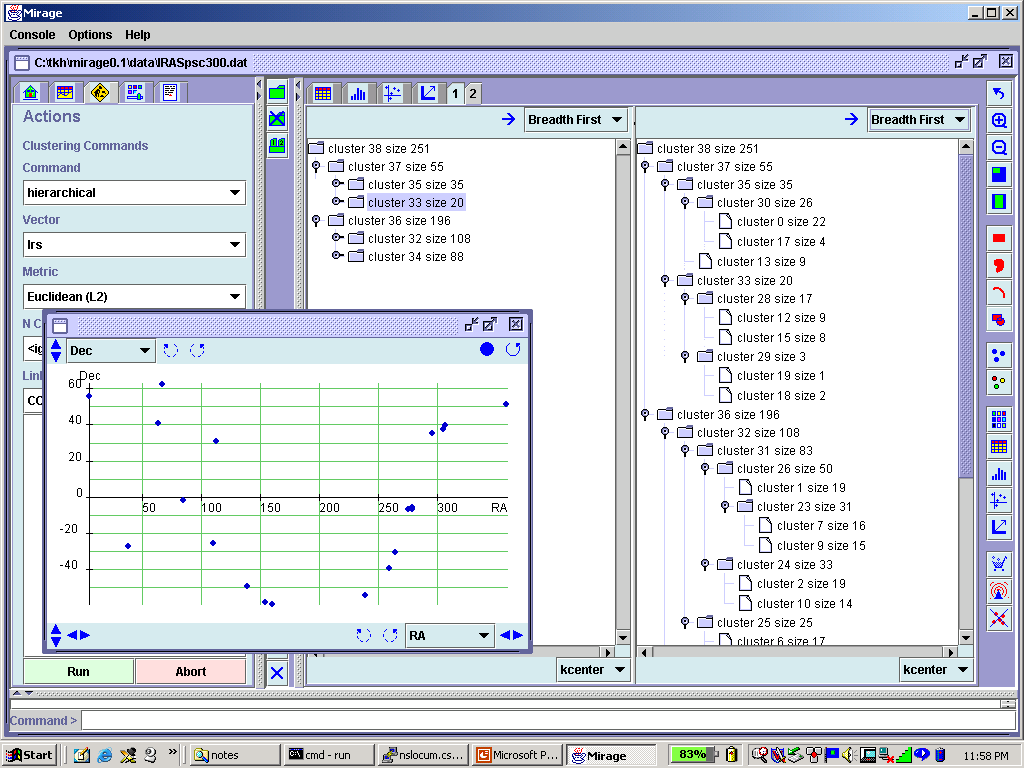
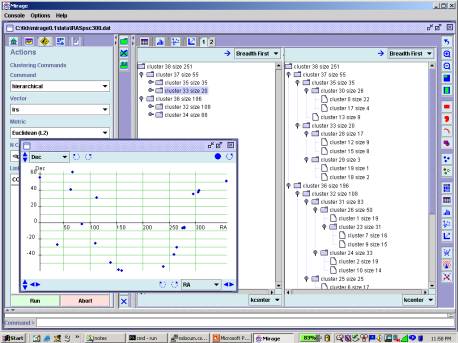
Exploring a hierarchical structure
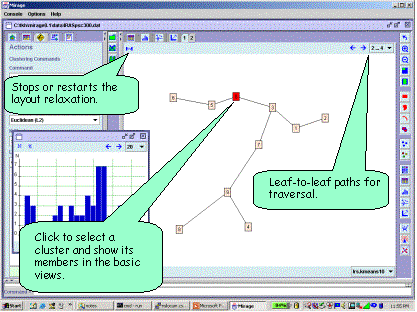
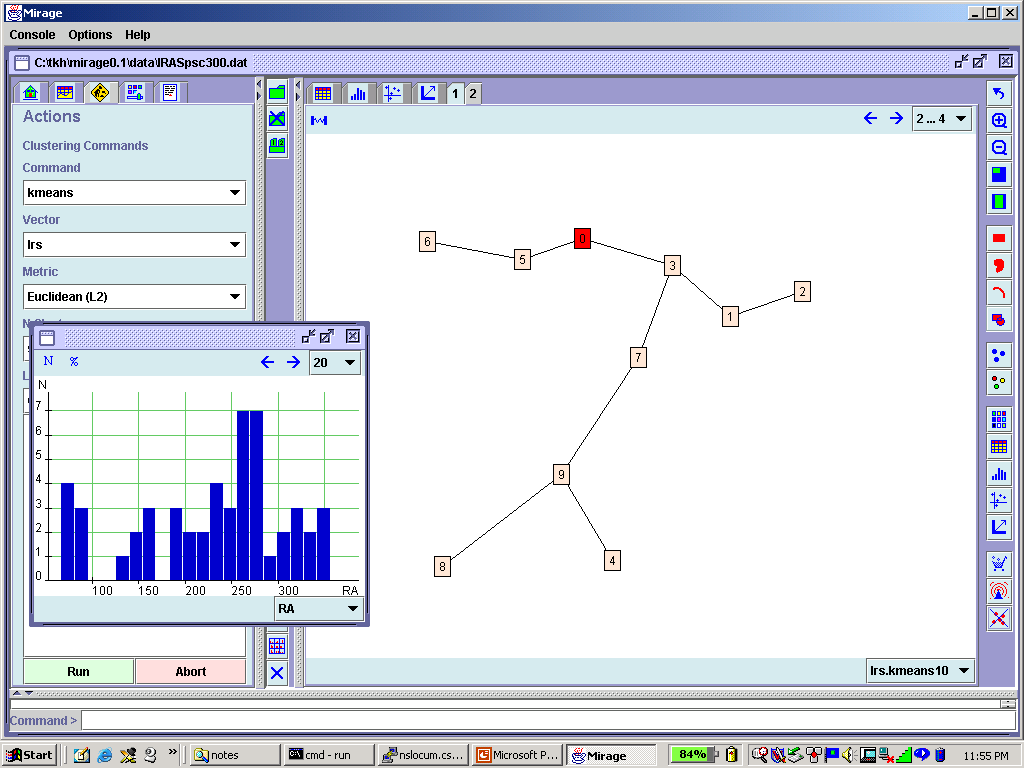
Exploring a partitional structure
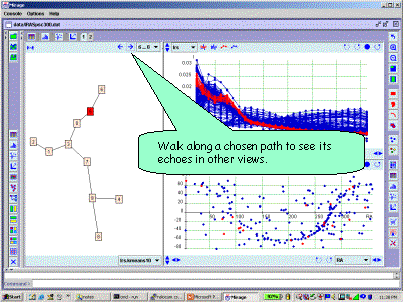
Walking in a cluster graph
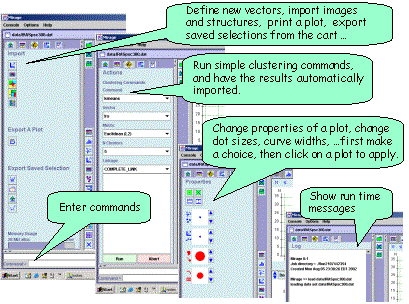
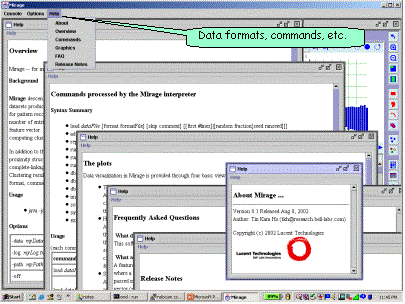
Commands and Command Menus
Manual pages

 Notes